|
|
|
|
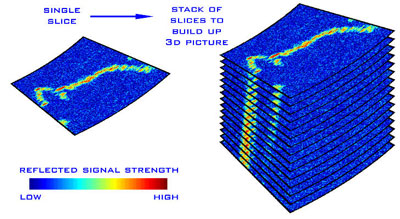
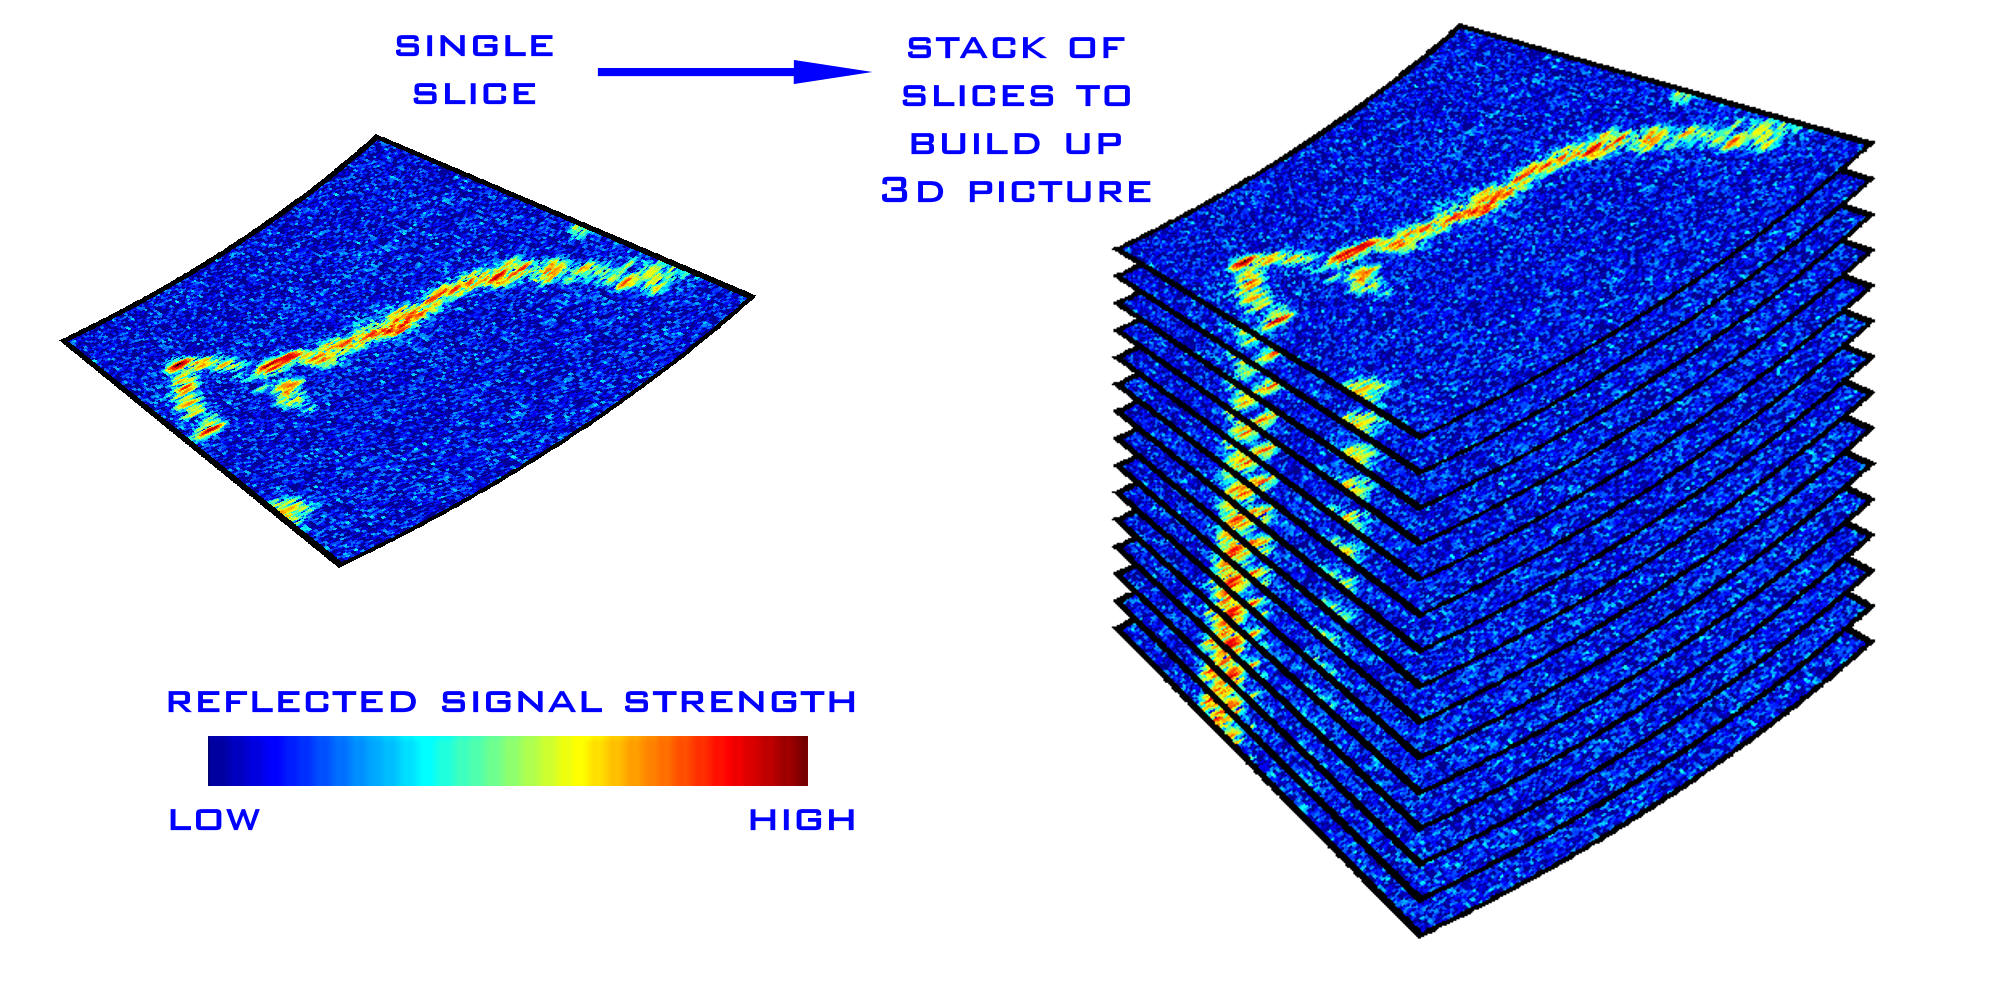
Once the beam has been scanned across the lava dome a map of the reflections can be made by colouring the strength of the radar reflections in the range spectrum. The reflections in the radar slice then trace out a contour line across the mountainside. Repeating this process pointing at different heights, AVTIS builds up a stack of slices each with a slightly different contour line.
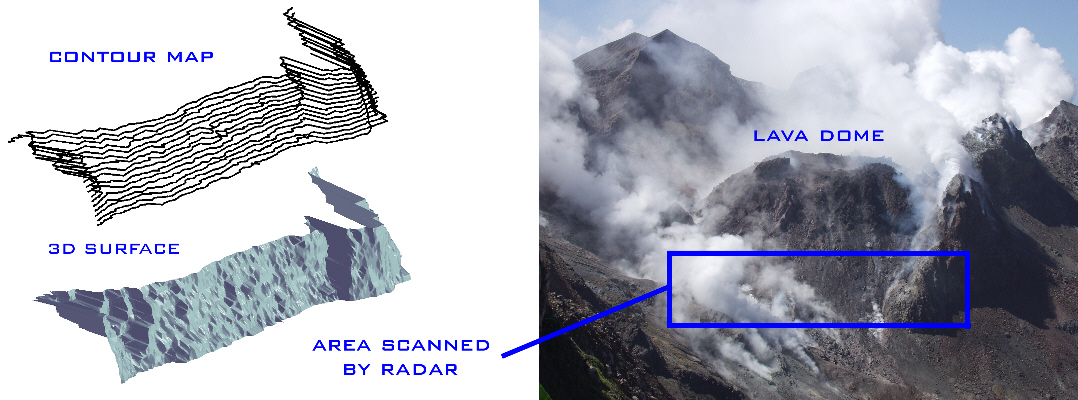
All of the contour lines contained within this stack of data can then be turned into a 3D surface inside the computer giving an accurate measurement of the lava dome shape. The picture below shows the 3D surface reconstructed by AVTIS from a scan over the bottom part of the lava dome on Montserrat.
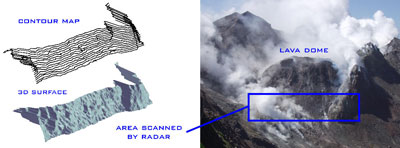
You can clearly see where the older
part of the dome bulges out on the right hand side.
Notice also how the radar can see straight through the
steam belching from the flanks of the volcano in the
picture. Steam, gas and ash are all made up of tiny
particles, much smaller than a millimetre in size, so
the mm-waves pass through and the bounce off of the
surface of the volcano instead.
|
|
|
|
|
|